 Runs On Your Cloud
 No Data Sharing
 No Contract Required
 Explore Now


 Face Verification
 Address Verification
 Document Verification
 Age Verification
 VideoIdent
 Fast ID
 eIDV
eIDV
 NFC Verification
 Consent Verification
 Business Verification
 Due Diligence
 Investor Verification
 E-Signature
 Behavioural Biometrics
 Device Fingerprinting
 MFA
MFA
 AML Screening
 Business AML Screening
 User Risk Assessment
 Transaction Screening
 Adverse Media Screening
 Identity Verification
 KYC
KYC
 KYB
KYB
 KYI
KYI
 Bonus Abuse
 Fraud Prevention
 Deepfakes
 Banking
 Crypto
 Fintech
 Forex
Forex
 Gaming
 Gig Economy
 Marketplace
 Social Networks
 Product Managers
 Compliance Officers
 Fraud Analyst
 Global Trust Platform
 Journey Builder
 Vendor Comparison
 Content library
 Blogs
Blogs
 News
News
 Reports
 Insights
 Knowledgebase
 ROI calculator
 Blind Spot Audit
 Deepfake Detection
 Liveness Detection
 Document Originality
 Document Deepfake
 Events & Webinar
 Podcast Studio
 Spotlight Studio
 API Documentation
 Mobile SDKs
 Service Status
 Help Center
 Contact Us
 Technical Support
 Compliance
 Supported Document
 About
About
 Career
 Press Release
 Certifications
 Partnership
 Awards
45 Eye‑Opening Money Laundering Facts & Statistics [2025 Update]
- 01 1 Why the 2025 Update Matters
- 02 2 Global Money‑Laundering in Numbers
- 03 3 Regional Hotspots & Sector Shake‑ups
- 04 4 Ten Emerging Laundering Tactics in 2025
- 05 5 Regulatory Shifts 2024‑2025
- 06 6 Shufti Analytics: Insights from 110 M Transactions (Jan–Apr 2025)
- 07 7 45 Surprising Facts & Statistics (Quick‑Fire List)
- 08 9 Conclusion
1 Why the 2025 Update Matters
Money‑laundering rules, fines and criminal tactics have all accelerated since the pandemic. In June 2025 the FATF rewrote Recommendation 16, the EU’s new AML Authority (AMLA) began direct supervision, and the U.S. Corporate Transparency Act finally took effect. At the same time, Shufti’s network recorded a 230 % YoY spike in deep‑fake ID attempts and generated 110 million transaction monitoring alerts in the first four months of 2025 alone. Fresh numbers matter – so we’ve refreshed every statistic and added Shufti’s own analytics.
2 Global Money‑Laundering in Numbers
Understanding the scale of illicit finance starts with the raw numbers. These headline metrics reveal just how entrenched money‑laundering remains in the global economy despite record‑breaking compliance spend and enforcement activity.
| Metric (2025) | Insight |
| $800 bn – $2 trn | 2–5 % of global GDP still washed each year (UNODC synthesis, WorldMetrics May 2025). |
| 1 % | Proportion of global Suspicious Activity / Transaction Reports (SAR/STR) that lead to investigation. |
| $4.6 bn | AML fines issued across 52 enforcement actions during 2024 (Fenergo, Feb 2025). |
| 16.2 % CAGR | Growth rate that will push the AML software market from $1.74 bn (2024) to $4.24 bn (2030) (Grand View Research, 2025). |
| 70 % | Share of laundering schemes that cross at least one border (WorldMetrics). |
| 40 % | Asia‑Pacific’s slice of global illicit flows, making it the world’s largest laundering hub. |
| 77 % | Financial institutions that detected or suspected laundering in the last 12 months. |
| €110 bn | Annual cost of money‑laundering to the EU economy (0.7 % of GDP). |
| >80 % | Rise in crypto‑related laundering between 2020‑2023; 2024–25 figures to follow. |
| 230 % | Surge in deep‑fake identity attacks logged by Shufti in Q1 2025. |
Key take‑away – the illicit economy is growing alongside enforcement and tech spend. Compliance teams need real‑time data, not last year’s PowerPoint.
3 Regional Hotspots & Sector Shake‑ups
Geography and industry matter: laundering networks gravitate toward jurisdictions or sectors where oversight is weakest and profits highest. The snapshot below highlights the regions and industries making headlines in 2025.
- United States: FBI estimates $300 bn is laundered through the U.S. annually; FinCEN’s new Beneficial Ownership Registry went live Jan 2024 and became fully enforceable Jan 23 2025.
- European Union: Suspicious‑transaction reports rose 15 % post‑AMLD5, and the EU Parliament delisted the UAE & Gibraltar from its grey list in July 2025 while adding ten new jurisdictions.
- Latin America: Laundering drains $160 bn a year (≈2 % of regional GDP); trade‑based schemes remain a top vector.
- APAC: Singapore and Hong Kong tightened Virtual‑Asset Service Provider (VASP) rules in 2025, extending Shufti clients’ onboarding times by 12 % as enhanced due‑diligence (EDD) kicks in.
- Africa & ME: Kenya and South Africa joined FATF’s grey list in Feb 2025; UAE real‑estate registers cut anonymous deals by an estimated 18 %.
4 Ten Emerging Laundering Tactics in 2025
Criminals constantly iterate. The tactics list below distils the most common red‑flags our analysts and global watchdogs have seen evolving over the past 18 months.
- Rapid fiat ⇄ crypto swaps via unregistered VASPs (22 % of Shufti SARs).
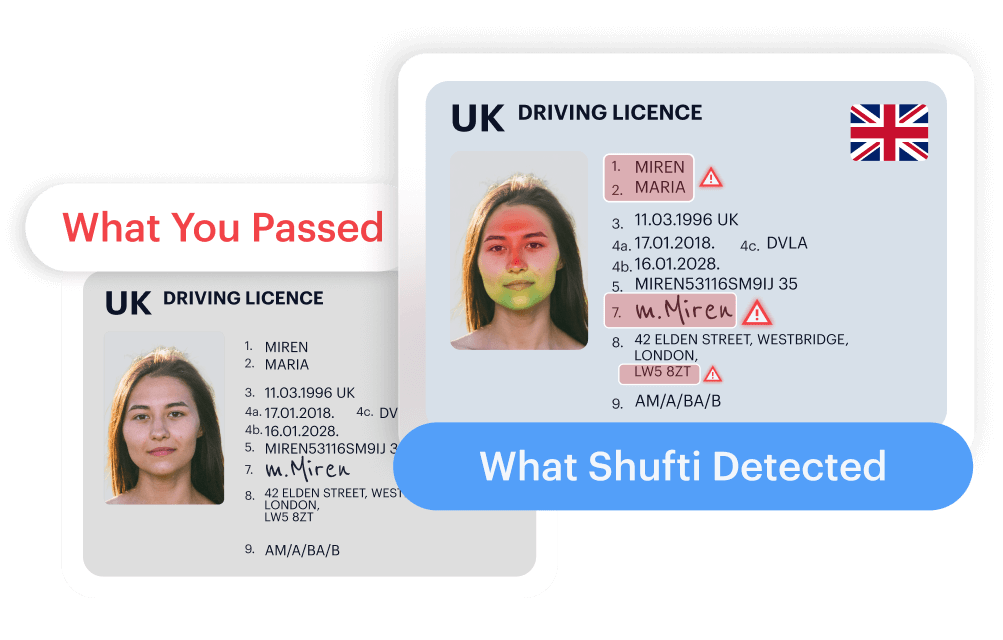
- Real‑time deep‑fake IDs bypassing outdated selfie checks.
- DeFi mixing pools that ‘wash’ tokens in seconds.
- Synthetic e‑residence IDs abused for EU expansion.
- Smurfed ATM chains just under €9 900.
- Round‑number month‑end transactions to mask payroll fraud.
- Dormant‑to‑active account spikes caught by behavioural baselines.
- Shell companies in non‑co‑operative havens avoiding UBO scrutiny.
- Loan‑proceeds pass‑throughs to third parties within 24 h.
- Device‑fingerprint farming – one IP, dozens of ‘clean’ accounts.
Pro‑tip: Pair velocity rules with AI‑based peer grouping to slice false positives by 30 %.
5 Regulatory Shifts 2024‑2025
Regulation is the single biggest driver of compliance change. The timeline captures the most impactful rule‑changes that compliance teams must operationalise in 2025.
| Date | Change | What it Means |
| 18 Jun 2025 | FATF revises Rec. 16 – mandatory payer/beneficiary data for x‑border payments ≥ USD/EUR 1 000. | Banks must upgrade ISO 20022 schemas and implement real‑time verification tooling. |
| Mar 2025 | EU AMLA begins supervisory cycle; EBA opens RTS consultation for the Single‑Rulebook. | Pan‑EU consistency, higher fines for repeat offenders. |
| Jan 23 2025 | U.S. Corporate Transparency Act upheld; reporting deadlines triggered. | Beneficial‑ownership data now part of CDD/KYB workflows. |
| Jun 2025 | FATF grey‑/black‑list refresh; Kenya, Laos, Lebanon &c. added. | Institutions must refresh geo‑risk scorings within 24 h. |
| UK 2025 | JMLSG v6.0 stresses AI model governance & explainability. | Audit‑ready model documentation becomes indispensable. |
6 Shufti Analytics: Insights from 110 M Transactions (Jan–Apr 2025)
Real‑world data beats theory. Drawing on more than a hundred million transactions screened this year, Shufti’s analytics provide a unique window into live laundering patterns.
- 22 % of SARs linked to rapid fiat‑to‑crypto swaps.
- 14 % triggered by wires from newly grey‑listed jurisdictions within one week of the FATF update.
- 56 % YoY increase in high‑risk alerts across sectors.
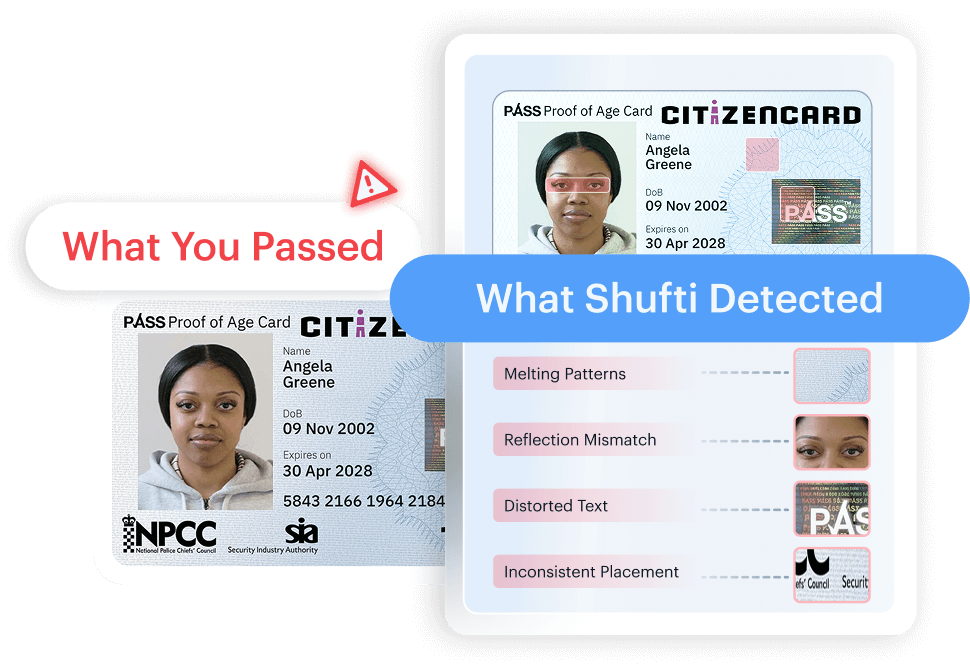
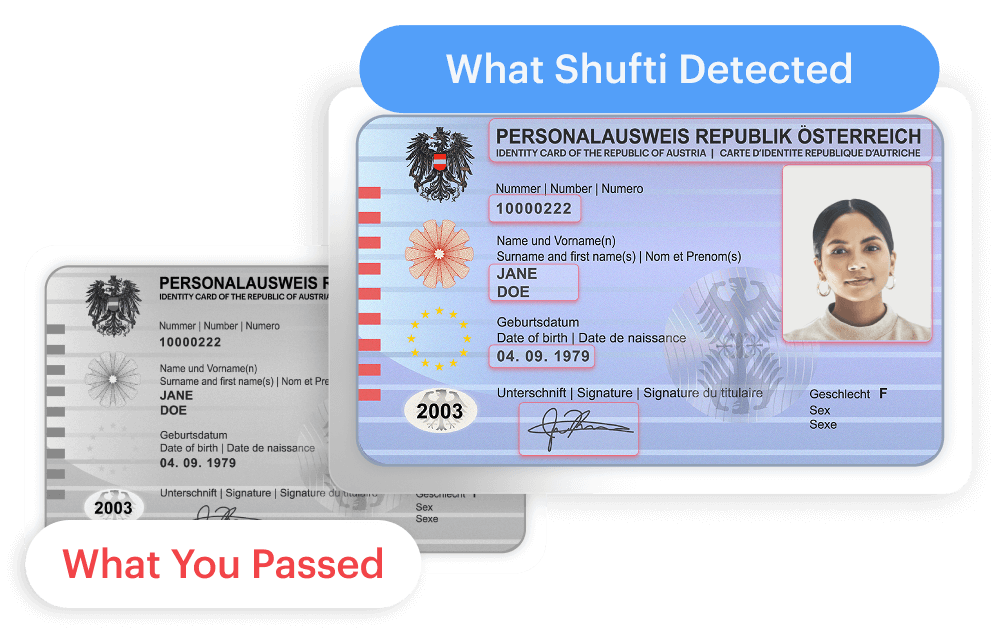
- 98.6 % precision achieved by Ghost‑Document Detector v2 against AI‑generated IDs.
- 60 % cost reduction delivered to clients who replaced rules‑only systems with Shufti’s hybrid analytics.
7 45 Surprising Facts & Statistics (Quick‑Fire List)
Need a stat for a board deck or risk memo? This quick‑fire list serves as your at‑a‑glance repository of headline figures, curated for 2025 relevance.
The first ten statistics paint the big‑picture landscape of illicit finance: how much is flowing, how often it is stopped, and the systemic weaknesses criminals exploit worldwide.
Global Snapshot (Facts 1‑10)
- 2–5 % of world GDP is laundered yearly – up to $2 trn.
- Only 0.1 % of illicit funds are ultimately recovered.
- 90 % of laundering still goes undetected.
- AML compliance now costs banks > $60 bn annually.
- Crypto‑related laundering grew 80 % 2020‑23.
- 25 % spike in laundering during COVID‑era volatility.
- Trade‑based laundering features in 46 % of cases.
- Real‑estate exploited in 25 % of global cases.
- Offshore financial‑centre usage up 35 % in a decade.
- Mobile‑money laundering cases now 25 % of Africa’s total.
Statistics 11‑17 shift focus to the regulatory muscle behind AML: the fines, investigations, and market consequences that turn compliance into a board‑level priority.
Enforcement & Fines (11‑17)
- $4.6 bn in fines across 52 cases during 2024.
- Average penalty per case: $88 m.
- Banking sector shoulders 69 % of fine value.
- Largest single 2024 fine: $900 m (EU).
- Average investigation lasts 18 months.
- 20 % dip in bank share‑prices after major AML scandal.
- 15 % annual growth in professional money‑laundering networks.
Money‑laundering risk is not evenly distributed. The next nine facts break down where illicit flows concentrate in 2025—and what’s driving regional divergences.
Regional Highlights (18‑26)
- Asia‑Pac handles 40 % of illicit flows.
- EU loses €110 bn a year to laundering.
- $300 bn washed through the U.S. yearly.
- Latin America bleeds $160 bn annually.
- UK banks file ~500 k SARs each year.
- UAE real‑estate oversight cut anonymous deals 18 %.
- Kenya & South Africa grey‑listing spiked EDD triggers 14 %.
- North America the largest AML‑tech market (2024).
- India forecast fastest AML‑tech CAGR 2025‑30.
Knowing the playbook is half the battle. Facts 27‑36 expose the structures, channels and tactics launderers rely on today.
Method & Modus Operandi (27‑36)
- 68 % of schemes use multilayered account structures.
- 35 % rely on fake invoices & trade docs.
- 22 % involve derivatives swaps for layering.
- 20 % linked to illegal gambling proceeds.
- 65 % intersect with cyber‑crime.
- 70 % leverage online payment rails.
- 30 % of AML investigations now involve SMEs.
- 200 m+ laundered via major sports sponsorships (2024).
- Average scheme lifespan: 24 months.
- Launderers now exploit AI chatbots for mule recruitment.
Finally, we spotlight Shufti’s data layer: exclusive analytics that show how AI and automation are redefining detection precision and operational efficiency.
Shufti & Tech‑Led Insights (37‑45)
- 110 m transactions analysed in Shufti’s Q1‑Q2 2025 dataset.
- 22 % of SARs involve unregistered VASPs.
- Deep‑fake ID attempts up 230 % YoY.
- Ghost‑Document Detector v2 hits 98.6 % precision.
- Clients cut manual review costs 60 % via Shufti hybrid analytics.
- False positives trimmed 30 % with behaviour + rules.
- Crypto off‑ramp flag reduces on‑chain dwell time by 45 %.
- Dynamic geo‑risk lists synced within 24 h of FATF updates.
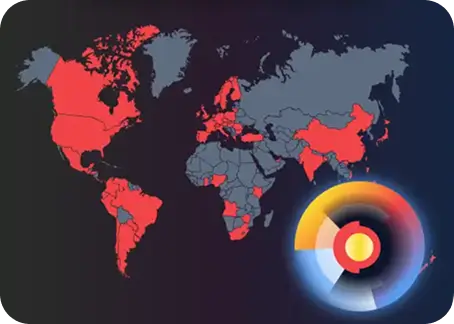
- Shufti serves 240+ countries & territories with 99.77 % accuracy.
9 Conclusion
Money‑laundering’s scale, speed and tech‑savvy have grown sharply since 2021. Meanwhile, regulators from the FATF to AMLA are tightening the net, and enforcement is breaking records. The stats above show why traditional, rule‑based compliance is no longer enough. By combining AI‑native analytics, real‑time data feeds and layered human review, Shufti clients cut manual costs by 60 % while boosting detection rates. The message for 2025 is clear: innovate, or watch illicit funds flow right past outdated controls.
Sources:
1- UNODC (2025). Global Report on Money Laundering.
2- Fenergo (Feb 2025). Financial Crime Report.
3- FATF (Jun 2025). Recommendation 16 Revision & Grey List Update.
4- Grand View Research (2025). Anti‑Money Laundering Software Market Size & Share.
5- WorldMetrics (May 2025). Illicit Financial Flows Dataset.
6- Shufti (2025). Ghost‑Document Detector v2 Performance Whitepaper.
Frequently Asked Questions
What is the biggest money-laundering risk in 2025?
Rapid fiat-to-crypto swaps via unregistered VASPs - they make up 22 % of Shufti-generated SARs.
How effective are current AML controls?
Despite $60 bn in annual compliance spend, <1 % of dirty money is seized, underscoring the need for AI-driven monitoring.
What does the FATF Travel-Rule update change?
From June 2025 all cross-border payments over USD/EUR 1 000 must carry standardised payer–payee data, raising the bar on screening accuracy.
How will the U.S. Corporate Transparency Act impact onboarding?
Financial institutions must collect BOI at entity creation, integrating it into CDD/KYB - non-compliance risks $500/day penalties.
Does AI help or hinder AML efforts?
Both - criminals use AI for deep-fake documents, but solutions like Shufti’s Ghost-Document Detector v2 achieve 98.6 % precision to stop them.


 for Identity Verification Solutions")


