


 Face Verification
 Address Verification
 Document Verification
 Age Verification
 VideoIdent
 Fast ID
 Docless Verification
 Consent Verification
 NFC Verification
 Business Verification
 Due Diligence
 Investor Verification
 E-Signature

 QES
QES
 AML Screening
 Transaction Monitoring
 Adverse Media
 Business AML Screening
 PEP & RCA
 Sanctions
 Watchlist
 Behavioural Biometrics
 Device Fingerprinting
 Biometric Face Authentication
 MFA
MFA
 Fraud Hub
 Onboarding
 Ongoing Monitoring
 KYC
KYC
 KYB
KYB
 KYI
KYI
 Age Assurance
 Identity Verification
 Workforce IAM
 Candidate Verification
 Compliance
 Fraud prevention
 Trust & safety
 Global expansion
 Product Managers
 Compliance Officers
 Fraud Analysts
 Developers
 Deepfake Detection
 Bonus Abuse / Promotion Abuse
 Account Takeover
 Synthetic Identity Fraud
 Document Fraud
 Impersonation Fraud
 Multi-Accounting
 Fraud Networks
 Chargeback Fraud
 Money Mule Activity
 Party Fraud
 Regulatory & Compliance Risks
 Fintech
 Crypto
 iGaming
 Forex
Forex
 Social Network
 Marketplace
 Banking
 Gig Economy
 Payments
 Ride Hailing
 Adult Content
 Blind Spot Audit
 Deepfake Detector
 Liveness Spoofs
 Document Originality
 Document Deepfake
 Global Trust Platform
 Journey Builder
 Case Management
 Shufti AI
 Fraud Analytics
 Vendor Comparison
 Brand Personalisation
 AI Compliance Co-Pilot
 OCR
OCR
 Secure Capture
 Deployment Options
 Identity Methods
 API Documentation
 Mobile SDKs
 Service Status
 Help Center
 Contact Us
 Technical Support
 Supported Documents
 Supported Countries
 Content library
 Blogs
Blogs
 News
News
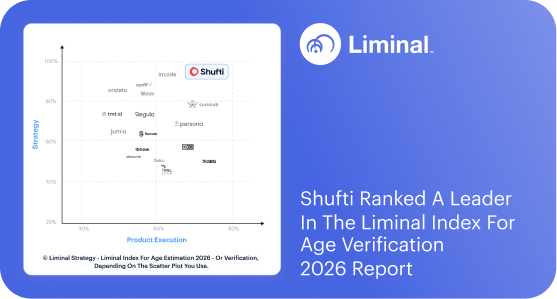
 Reports
 Insights
 Knowledgebase
 ROI calculator
 About
About
 Career
 Press Release
 Certifications
 Partnership
 Awards
 Events & Webinar
 Interactive Demo
 Podcast Studio
 Spotlight Studio
Identity Verification Match Rates & Metrics Explained

When an identity verification system tells you it achieved “99% accuracy,” that number tells you nothing on its own. Accuracy compared to what benchmark? Across which demographics? Using which definition of a “correct” result?
Compliance teams and fraud managers face this problem every day. Vendors publish impressive-sounding numbers, but without a shared vocabulary, direct comparison is nearly impossible. This guide gives you that vocabulary, using government-published benchmarks as the objective reference.
What Is a Match Rate in Identity Verification?
A match rate is a biometric metric. It measures how often a system correctly confirms that two samples (a live selfie and a document photo, for example) come from the same person. The system compares the two facial templates and produces a similarity score; if the score clears a set threshold, it returns a match.
Match rate sits inside a broader family of IDV metrics, and confusing them is one of the most common mistakes buyers make when reading vendor specifications. The three terms that cause the most confusion are:
Pass Rate:
The percentage of submitted verification attempts that reach an approved outcome. This includes automated approvals and human-reviewed approvals. A high pass rate could reflect either genuine accuracy or a system that is configured to be permissive.
Accuracy Rate:
How often the system produces the correct answer, whether that answer is “match” or “no match.” A system can have high accuracy by being very conservative (rejecting most borderline cases) at the cost of a high friction rate for legitimate users.
Match Rate:
Specifically measures performance on the biometric comparison step. It does not include document authenticity checks, liveness decisions, or human review outcomes.
Understanding which metric a vendor is citing is the starting point for any meaningful evaluation. For a deeper look at pass rate versus accuracy rate in practice, this breakdown covers the operational implications for onboarding teams.
Understanding FAR and FRR: The Security-Usability Trade-Off
The two most important biometric metrics for fraud and compliance teams are the False Acceptance Rate (FAR) and the False Rejection Rate (FRR).
False Acceptance Rate (FAR):
FAR is the percentage of impostor attempts that the system incorrectly accepts. A fraudster presenting someone else’s document photo who gets through is a false acceptance. A low FAR means strong fraud protection.
False Rejection Rate (FRR):
FRR is the percentage of genuine users the system incorrectly rejects. A legitimate customer whose face does not match their passport photo well enough to clear the threshold is a false rejection. A high FRR means friction, drop-off, and lost revenue.
The relationship between FAR and FRR is a trade-off governed by the decision threshold. Lower the threshold (more permissive) and you reduce FRR but raise FAR. Raise it (more restrictive) and you reduce FAR but raise FRR. The Equal Error Rate (EER) is the point where FAR and FRR are equal, often used as a single-number summary of a system’s inherent capability before threshold tuning.
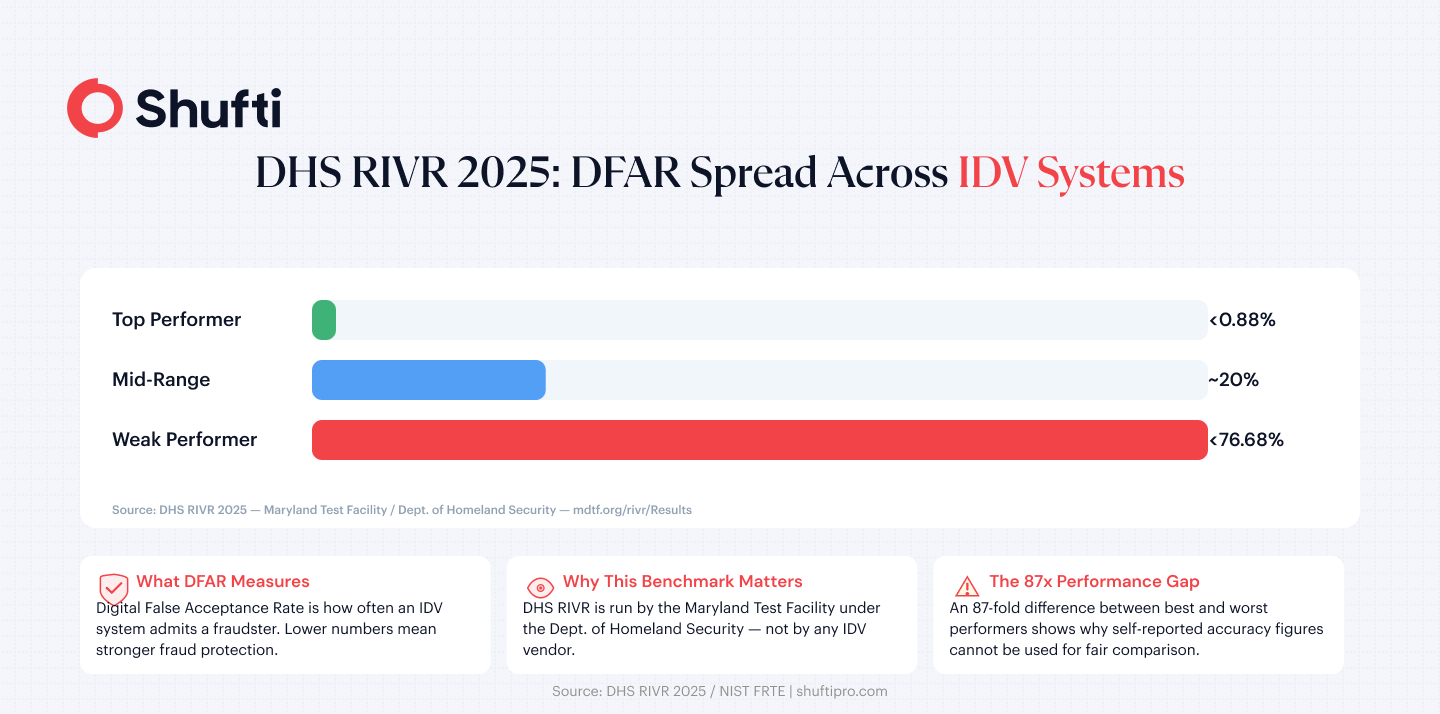
The DHS Remote Identity Validation Rally (RIVR), run by the Maryland Test Facility under the Department of Homeland Security, provides the most authoritative independent benchmark available for commercial IDV systems. RIVR 2025 results show the Digital False Acceptance Rate (DFAR) ranging from below 0.88% for the strongest performers to below 76.68% for the weakest, an 87-fold difference across systems claiming to offer identity verification. No vendor self-reported figure reflects this spread; independent testing does.
The NIST Face Recognition Technology Evaluation (FRTE) provides a parallel benchmark specifically for face recognition algorithms. NIST data shows False Match Rates ranging from 0% to below 1.66%, and False Non-Match Rates from below 0.08% to below 99.66% across the tested algorithm landscape. A vendor claiming “99% accuracy” without specifying whether that figure is FMR, FNMR, or something else entirely is giving you an incomplete picture.
Why Vendor Accuracy Claims Can Be Misleading
Even a genuinely accurate system can produce misleading headline numbers depending on how the evaluation was structured.
Demographic Variation:
Demographic variation is a well-documented source of inconsistency. The World Bank ID4D Biometrics Primer notes that biometric match rates vary meaningfully across age groups, skin tones, and document quality. A system trained or tested predominantly on one demographic may perform materially differently on your actual user population.
Controlled vs. Real-World Conditions:
Controlled vs. real-world conditions matter too. A system tested with studio-quality selfies will outperform the same system on mid-range mobile devices under variable lighting. Most vendor accuracy claims come from controlled environments; real-world pass rates are consistently lower.
Threshold tuning for the demo:
Threshold tuning for the demo is another common pattern. A vendor can configure their system to maximise accuracy on a curated dataset, then ship a differently configured system. Without access to the test methodology, the headline number is not reproducible.
Exclusion of human review outcomes:
Exclusion of human review outcomes inflates automated accuracy figures. A system that escalates 15% of cases to a human reviewer often publishes accuracy based only on the 85% it decided confidently, omitting the rest.
The practical implication: ask vendors for third-party benchmark results (NIST FRTE, DHS RIVR) and ask explicitly which metric they are reporting and under what test conditions. See also this identity verification evaluation guide for a broader breakdown of what the evaluation process should cover.
How Match Rates Drive Onboarding Drop-Off
Match rate and FRR are not just compliance metrics. They are revenue metrics.
Every false rejection is a legitimate customer who could not complete onboarding. In high-volume fintechs, even a 2–3% FRR on the biometric step creates material drop-off, especially when friction is unexpected and the user cannot easily retry.
NIST Special Publication 800-63A provides guidance on Identity Assurance Levels (IALs) and the acceptable balance between security controls and user accessibility. IAL2 (the level required for most regulated financial services) demands a robust identity verification system but does not require that verification to be maximally restrictive. The specification explicitly acknowledges the trade-off between error rates and equity of access.
A system that aggressively minimises FAR at the cost of a high FRR is not necessarily the most compliant option. It may simply be the most conservative one, at the expense of user experience and inclusion.
What Metrics Should Compliance Teams Track?
If you are evaluating an IDV vendor or auditing your existing solution, the metrics worth tracking are:
DFAR / FAR:
Your primary fraud exposure metric. Reference it against DHS RIVR benchmark results, not just the vendor’s self-reported figure.
FRR / FNMR:
The rate at which legitimate users are rejected. Track this separately from overall pass rate; high FRR hidden inside an acceptable overall figure (because human review recovers the rejects) signals a system under unnecessary strain.
Failure to Enrol Rate (FTE):
How often the system cannot process a submission due to image quality. A high FTE points to UX or device-compatibility gaps before the match step even runs.

EER:
The Equal Error Rate, useful for comparing systems on a normalised basis independent of threshold configuration.
Demographic parity:
Are FRR and FAR consistent across age groups, nationalities, and document types? Inconsistency is a regulatory and ethical risk under GDPR and the EU AI Act.
For a closer look at how biometric checks feed into modern fraud prevention, this guide to face ID checks covers the liveness and presentation-attack dimensions alongside standard biometric metrics.
| Shufti’s Identity Verification and Face Verification solutions are independently validated through DHS RIVR 2025, achieving top-performer status across DHS benchmark goals. With FAR below 0.001, TAR at approximately 99%, and 56+ anti-spoofing layers covering deepfakes, 3D masks, and injection attacks, the platform is built for compliance teams that need accuracy claims they can show to a regulator. Hybrid AI and human review is available for edge cases, with deployment options across cloud, on-premises, and hybrid environments. If your current vendor cannot answer the metrics questions this article raised, request a demo to see how a government-validated system responds to the same standard. |
Frequently Asked Questions
What is the difference between match rate and pass rate in identity verification?
Match rate measures how often the biometric comparison step correctly links two samples to the same person. Pass rate measures the overall percentage of submissions that receive an approved outcome, including human-reviewed cases.
What is a False Acceptance Rate (FAR)?
FAR is the percentage of fraudulent or impostor attempts that a biometric system incorrectly approves. A lower FAR means stronger fraud protection.
What is the difference between FAR and FRR?
FAR measures how often fraudsters get through; FRR measures how often genuine users get rejected. Lowering one tends to raise the other, which is why threshold configuration and independent benchmarking both matter.
What is a mismatch rate in identity verification?
Mismatch rate refers to the frequency with which a system fails to correctly match a live user to their identity document. It is functionally similar to the False Non-Match Rate (FNMR) used in biometric standards.
Why can’t you always trust vendor accuracy claims?
Vendor figures are typically self-reported, tested under controlled conditions, and may exclude human-reviewed cases or demographic subgroups where performance is weaker. Independent benchmarks like NIST FRTE and DHS RIVR use standardized, reproducible test conditions that make cross-vendor comparison meaningful.


: Meaning, Requirements, and When You Need One")


