


 Face Verification
 Address Verification
 Document Verification
 Age Verification
 VideoIdent
 Fast ID
 Docless Verification
 Consent Verification
 NFC Verification
 Business Verification
 Due Diligence
 Investor Verification
 E-Signature

 QES
QES
 AML Screening
 Transaction Monitoring
 Adverse Media
 Business AML Screening
 PEP & RCA
 Sanctions
 Watchlist
 Behavioural Biometrics
 Device Fingerprinting
 Biometric Face Authentication
 MFA
MFA
 Fraud Hub
 Onboarding
 Ongoing Monitoring
 KYC
KYC
 KYB
KYB
 KYI
KYI
 Age Assurance
 Identity Verification
 Workforce IAM
 Candidate Verification
 Compliance
 Fraud prevention
 Trust & safety
 Global expansion
 Product Managers
 Compliance Officers
 Fraud Analysts
 Developers
 Deepfake
 Bonus Abuse / Promotion Abuse
 Account Takeover
 Synthetic Identity Fraud
 Document Fraud
 Impersonation Fraud
 Multi-Accounting
 Fraud Networks
 Chargeback Fraud
 Money Mule Activity
 Party Fraud
 Regulatory & Compliance Risks
 Fintech
 Crypto
 iGaming
 Forex
Forex
 Social Network
 Marketplace
 Banking
 Gig Economy
 Payments
 Ride Hailing
 Adult Content
 Blind Spot Audit
 Deepfake Detector
 Liveness Spoofs
 Document Originality
 Document Deepfake
 Global Trust Platform
 Journey Builder
 Case Management
 Shufti AI
 Fraud Analytics
 Vendor Comparison
 Brand Personalisation
 IDV Modes
 AI Compliance Co-Pilot
 OCR
OCR
 Secure Capture
 Deployment Options
 Identity Methods
 API Documentation
 Mobile SDKs
 Service Status
 Help Center
 Contact Us
 Technical Support
 Supported Documents
 Supported Countries

 Content library
 Blogs
Blogs
 News
News
 Reports
 Insights
 Knowledgebase
 ROI calculator
 About
About
 Career
 Press Release
 Certifications
 Partnership
 Awards
 Events & Webinar
 Interactive Demo
 Podcast Studio
 Spotlight Studio
The 1% problem: what a single point of KYC pass rate is worth

- 01 TL;DR
- 02 Viewing Pass Rate with the Lens of a Revenue Metric not a Compliance One
- 03 What does 1% actually mean at scale?
- 04 Where the pass-rate gap originates
- 05 Why hard markets pay the steepest pass-rate tax
- 06 The false-reject problem hiding in plain sight
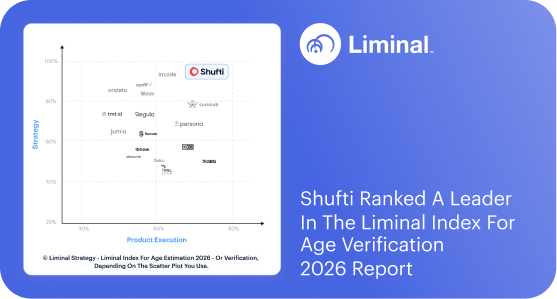
- 07 How Shufti addresses the pass-rate gap
TL;DR
- Most companies treat KYC pass rate as a compliance metric. It is a revenue metric.
- Every false reject is a customer whose acquisition cost you already spent.
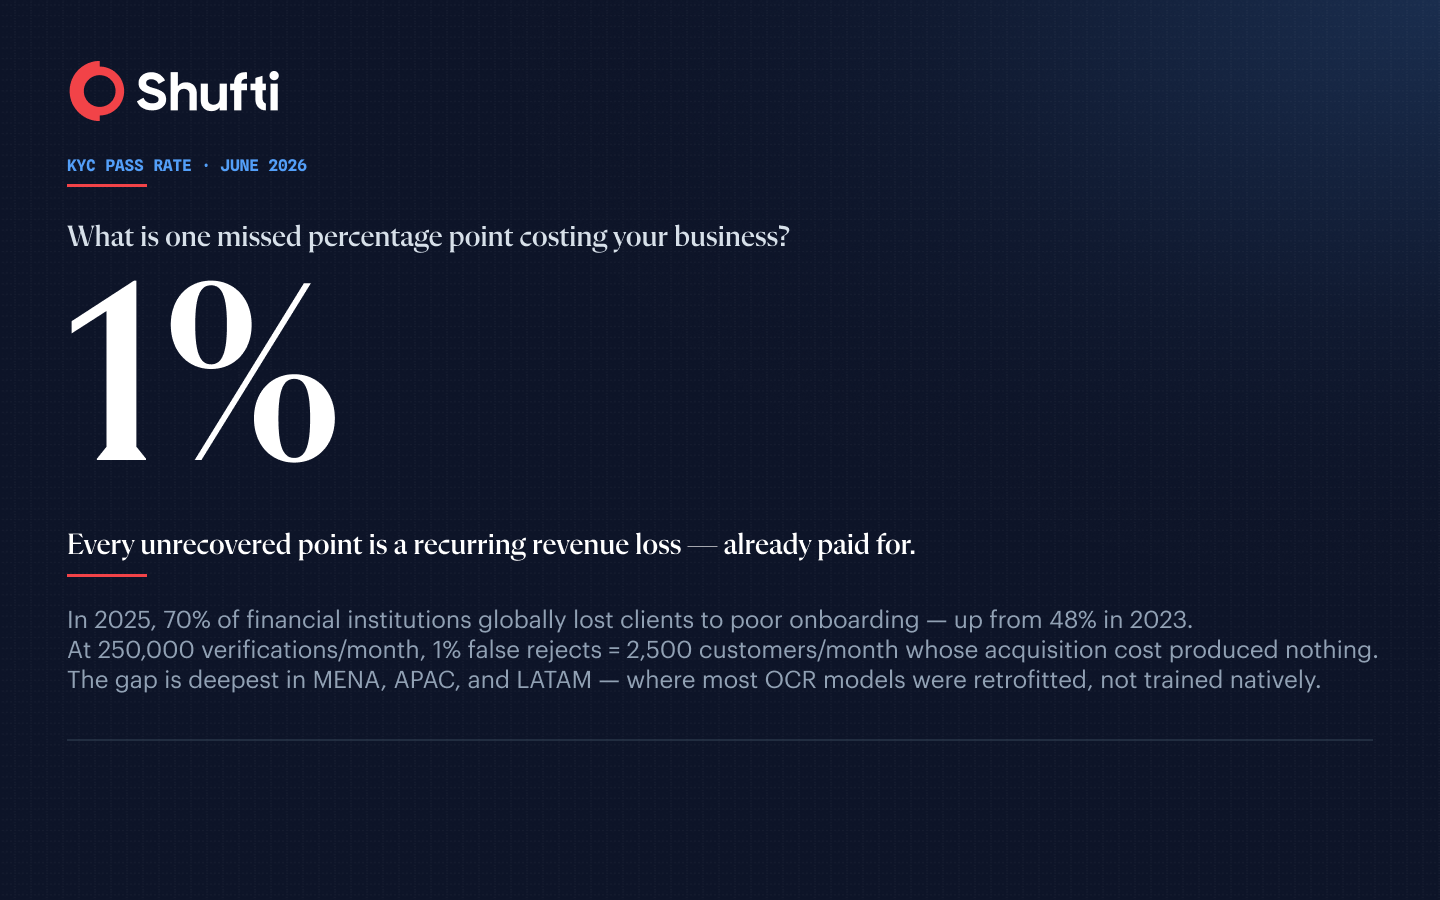
- In 2025, 70% of financial institutions globally lost clients to poor onboarding, up from 48% in 2023.
- The pass-rate gap is deepest in MENA, APAC, and LATAM, where most OCR wasn’t trained for the local documents.
- Recovering 1% at the identity gate costs less than acquiring a single replacement customer.
The moment a user submits their documents in your KYC flow, you’ve already spent their acquisition cost. The paid search click that brought them in, the app install, the welcome email sequence, the retargeting impression that finally converted them after three weeks. All of it is already on the ledger, regardless of what happens at the identity gate.
If verification rejects them, not because they are fraudulent but because your OCR couldn’t parse their Gulf-issued ID, or your liveness model misread a legitimate blink, or a compliance rule calibrated for one market quietly flagged an edge case in another, that customer is gone. The customer acquisition cost is a write-off. The lifetime value you projected is zero.
That’s the 1% problem. Not a compliance gap. A revenue gap. And it compounds silently, at scale, in ways most KYC teams are not measuring.
This guide maps the economics of KYC pass rate: what the metric actually means for your business, how to calculate what a single percentage point is worth, where the gap originates, and why it hits hardest in the markets that matter most for growth. The argument is not that compliance rigour should be loosened. It is that most organisations are measuring the wrong thing, attributing the wrong cost to the wrong team, and leaving recoverable revenue on the table every month as a result.
Viewing Pass Rate with the Lens of a Revenue Metric not a Compliance One
KYC pass rate measures the percentage of identity verification attempts that result in a successful approval within a given time period. Most teams track it in a compliance dashboard. Very few have connected it to their revenue model.
That framing error is the root cause of the 1% problem.
The misconception that keeps the gap invisible
The compliance frame treats a failed KYC check as a neutral or positive outcome: the system worked, an unverified user didn’t get through. This makes sense for the fraud team. It makes no commercial sense for the growth team.
A pass rate of 84% does not mean 84% of your users were legitimate and 16% were fraudsters. It means 84% of your users got through. The 16% who didn’t fall into three rough categories: genuine fraudsters (a small minority in most regulated products), legitimate users rejected in error, and legitimate users who hit friction and abandoned before completion.
All three look the same in a compliance dashboard. They look very different in a revenue model. One category is a security outcome. The other two are customer losses that carry full acquisition cost and zero lifetime value.
Separating them is the first discipline that turns pass rate from a hygiene metric into a commercial one.
The gate economics
Consider where a user is in your funnel when they reach identity verification. They have downloaded the app, created an account, entered their personal details, and agreed to your terms. The acquisition spend, whether paid channel or organic, is already on the ledger.
If the verification fails and the user doesn’t return, you’ve paid to acquire that customer and received zero lifetime value. The cost is entirely lost. The only path forward is to acquire another user at the same acquisition cost, with the same underlying pass-rate problem still in place.
This is why a 1% false rejection rate is not a compliance rounding error. At 250,000 verifications per month, it is 2,500 customers per month whose full acquisition cost produced nothing. No fine, no audit flag, no regulatory notice. Just silent revenue loss, tracked nowhere in most organisations.
The gap between how compliance teams measure KYC performance and how growth teams measure onboarding performance is where the problem lives. Compliance teams measure pass rate against a baseline of expected fraud rates and regulatory thresholds. Growth teams measure activation, conversion, and CAC efficiency. Neither team, in most organisations, owns the intersection, which means neither team is responsible for the cost of false rejects. That structural blind spot is what turns a manageable 1% gap into a persistent one.
What does 1% actually mean at scale?
One percentage point of KYC pass rate is worth a different amount depending on your verification volume, your customer acquisition cost, and the lifetime value of a successfully onboarded user in your segment. The table below uses illustrative assumptions. Your figures will differ, but the structure of the argument holds regardless of the exact inputs.
|
Monthly verifications |
Baseline pass rate |
1% improvement |
Additional customers/month |
At $100 CAC recovered |
At $500 LTV per customer |
|
50,000 |
85% |
86% |
500 |
$50,000/month |
$250,000/month |
|
250,000 |
85% |
86% |
2,500 |
$250,000/month |
$1.25M/month |
|
1,000,000 |
85% |
86% |
10,000 |
$1M/month |
$5M/month |
These are illustrative scenarios. $100 CAC and $500 LTV are mid-range estimates; your actual figures by market, channel, and product segment will vary. Use your own unit economics to run the calculation.
The CAC column captures the immediate cost recovery. You stop writing off acquisition spend on users who should have converted. The LTV column captures the forward value. You are not just stopping a loss, you are recovering compounding revenue from customers with long product relationships ahead of them.
The LTV multiplier changes the case
The higher the lifetime value of a successfully onboarded customer in your segment, the more each percentage point of pass rate is worth. A regulated FX broker with institutional clients and multi-year relationships has a fundamentally different calculus than a consumer neobank with low average revenue per user. But the direction is the same in both: the gate is where the economics live, and every point of pass rate you leave unrecovered is a recurring cost.
The other variable that shifts the calculation is the nature of the product. In a lending product, a successfully verified borrower generates fee income from day one. In a trading or investment product, they generate ongoing transaction revenue. In a payments product, they generate interchange across every transaction. Each of those revenue profiles changes the LTV figure in the table above, but none of them changes the core logic: you paid to get the user to the gate, and a false reject means that spend was wasted.
The asymmetry most teams miss
The 1% problem has a compounding dynamic that makes it especially hard to detect. False rejects generate no alerts. They generate silence. A declined user closes your app and does not return. They do not call your support line to explain that your OCR couldn’t parse their Vietnamese national ID. They leave.
False accepts, by contrast, generates downstream signals. Fraud losses, chargebacks, and suspicious transaction flags all have named owners in the organisation. False rejects have no natural owner in most organisations, because the loss is invisible and the person most affected is not yet a customer. The result is that KYC teams calibrate heavily against false accepts and systematically underinvest in fixing false rejects.
Where the pass-rate gap originates
Pass rate failures cluster around three root causes. Knowing which one is driving your gap determines where to invest first.
Document quality and OCR accuracy
The most common first-pass failure mode is a document the system cannot read with enough confidence. This covers physically worn or damaged documents, photographs taken in poor lighting conditions, and, critically, document types and scripts that the underlying optical character recognition model was not trained to handle.
The third category is structural, not operational. If your verification vendor built their OCR on Western documents and retrofitted support for the rest, the failure rate on Arabic, Thai, Vietnamese, or Cyrillic documents will be meaningfully higher than on European or North American ID formats. That is not a user error. It is a training data gap that shows up as a systematic pass-rate penalty at the geography level.
Liveness and biometric retry rates
Biometric verification adds a second point where users drop off. Active liveness prompts (blink, turn your head, speak a phrase) introduce friction that not all users complete. Every retry attempt before a user abandons represents a conversion loss that compounds with the document failure rate.
A platform with 95% first-attempt liveness success and 90% document OCR success has a combined first-pass rate of roughly 85.5%, before any AML screening or data validation steps. Each subsequent gate that sits below 100% multiplies the others. The aggregate effect is almost always worse than teams expect when they review individual step metrics in isolation. Tracking each step’s completion rate in sequence, rather than in aggregate, is what reveals whether the bottleneck is the document layer, the biometric layer, or the data validation layer, because each requires a different remediation path and a different vendor conversation.
Data validation and rule miscalibration
Compliance rules calibrated for one market or one risk profile can function as false-reject generators when applied elsewhere. An address validation rule built for UK postcodes may flag a legitimate UAE address format as anomalous. A name-matching threshold tuned for Latin-script names produces higher mismatch rates against Arabic or Chinese romanisations. Date-of-birth format conventions that differ between markets (day/month/year versus month/day/year) introduce a systematic source of field mismatches that can trip document validation rules set against a specific regional convention.
These are solvable at the rule level. But they are only solvable if your team knows they are happening. Without pass rate tracked by step, by document type, and by geography, miscalibrated rules remain invisible until someone notices the abandonment curve. The diagnostic step most teams skip is breaking overall pass rate into component rates by step and geography. A 92% document capture success rate and a 91% liveness success rate look healthy in isolation. Combined with an 88% data validation success rate in specific markets, the aggregate first-pass rate is under 75%, a significant commercial problem hiding inside acceptable-looking individual metrics.
Why hard markets pay the steepest pass-rate tax
The pass-rate gap is not evenly distributed. It is deepest in the markets where most verification vendors were not trained to operate natively: MENA, APAC, and LATAM.
A fintech company expanding into Southeast Asia, the Gulf, or Brazil is entering markets where document formats, script systems, and ID structures differ substantially from the European and North American documents most vendors’ OCR models were originally trained on. Vendors who retrofitted those markets, adding languages and document types after the fact rather than training on them from the start, carrying a structural accuracy deficit that shows up directly in pass rates.
The commercial consequence is acute. Singapore illustrates it with unusual clarity. 76% of Singaporean financial institutions lost clients due to slow and inefficient onboarding in 2025, despite Singapore’s banks known to be fast in onboarding across the world. Speed without accuracy is not a solution. High transaction volume processed quickly, with a structural pass-rate gap underneath, produces the worst possible outcome: a large number of customers turned away efficiently.
For a neobank, a crypto exchange, or an FX broker operating across Southeast Asia or the Gulf, the pass-rate gap in hard markets is not a theoretical risk. It is the single largest driver of customer acquisition cost waste in the onboarding stack. And it is largely invisible on standard reporting, because the output, a slightly lower conversion rate from verification to activation, looks like a product problem, a marketing problem, or a market-maturity problem. Rarely does it get traced back to the document intelligence layer.
The growth market paradox
The markets with the highest user acquisition costs are frequently the same markets with the deepest pass-rate gaps. Paid acquisition in competitive fintech environments in APAC and MENA is not cheap. Losing two or three percentage points of pass rate in those markets does not just cost you customers. It costs you the most expensive customers in your portfolio to acquire.
In 2025, 70% of financial institutions globally reported losing clients to inefficient onboarding. That trend line is not driven by firms getting worse at KYC operationally. It is driven by geographic expansion into harder markets where the legacy verification stack was not built to perform, combined with rising user expectations that make friction at the identity gate less tolerable than it was five years ago.
The false-reject problem hiding in plain sight
False rejects are the invisible side of the KYC accuracy equation. Every KYC process has two failure modes: approving someone who should not pass (false accept) and rejecting someone who should pass (false reject). Regulatory frameworks, correctly, penalise the former. There is no regulatory penalty for the latter.
That asymmetry shapes how KYC teams invest their time and budget. AML fines totaled $1.23 billion in the first half of 2025 alone, a 417% increase on the $238.6 million recorded in H1 2024. The pressure to minimize false acceptances is visible, growing, and has a named owner in every regulated organisation.
The cost of false rejects appears in none of those reports. It appears in your churn data, your unit economics, and your acquisition cost efficiency, none of which sit in the compliance team’s purview. Nobody is accountable for the gap across most organisational structures, so the gap persists.
Why the loss never shows up on a single report
The false-reject cost lives in the gap between what your user acquisition economics project and what your activated-customer metrics deliver. If your growth model assumes an 85% pass rate but your actual rate is 82%, that three-point gap is a direct, quiet, ongoing tax on every marketing dollar you spend. It does not appear as a line item anywhere. It appears as “worse than expected activation rates” with no obvious cause, until someone traces the abandonment back to the identity gate and runs the calculation.
Firms running that level of investment in the compliance stack often have no parallel investment in understanding what share of that cost is being wasted on false rejects rather than genuine fraud prevention.
Part of the reason this gap persists is that false-reject costs are cross-functional. The marketing team sees higher-than-expected cost per activated customer. The product team sees a drop-off at the verification step. The compliance team sees a pass rate that looks acceptable. None of them own the problem end-to-end. Building a shared metric, tracked as pass rate by step, geography, and document type and reported to both compliance and growth stakeholders, is the structural fix that makes the 1% problem visible without requiring an organisational restructure.
Connecting the pass-rate gap to the acquisition layer, by tracking rate by step, by document type, by geography, and by retry count, is the diagnostic step that makes the 1% problem visible and actionable before another quarter of silent loss.
How Shufti addresses the pass-rate gap
The pass-rate problem in hard markets is structural, not operational. Vendors who built their OCR on Western documents and retrofitted the rest hit a ceiling in MENA, APAC, and LATAM that better user experience design alone cannot raise.
Shufti’s document intelligence was trained natively on 10,000+ document types across 240+ countries from the start, with proprietary OCR covering 150+ languages and no human fallback for low-confidence reads. That structural choice is what allows clients in the hardest markets to maintain pass rates that vendors with retrofitted stacks cannot reach. XM/Trading Point, a multi-licensed FX broker operating across 190+ countries and serving 15 million+ clients, relies on Shufti specifically for Southeast Asia and MENA pass-rate performance, because the ceiling in those markets is lower with every alternative they evaluated. Stripe, despite running its own verification capability, reaches for Shufti for MENA and APAC documents.
See how Shufti’s identity verification handles your hardest markets on real documents and book a demo.
Frequently Asked Questions
What is a good KYC pass rate?
Benchmarks vary by segment, geography, and verification stack. A well-calibrated flow in a mature Western market typically runs between 85% and 92% first-pass. In hard markets, specifically MENA, APAC, and LATAM, pass rates with vendors whose OCR was not trained natively on regional documents run materially lower. The more useful question is not "what is a good pass rate?" but "what is my false-reject rate by geography and document type? That is where actionable gaps live.
How does KYC pass rate differ from KYC accuracy rate?
Pass rate measures the share of verification attempts that result in approval. Accuracy rate measures how correct those decisions are, counting both approvals and rejections. A system can have a high pass rate by approving too liberally (high false-accept rate), or a low pass rate by rejecting too aggressively (high false-reject rate). Optimising for pass rate without tracking accuracy can increase fraud exposure. Optimising for accuracy without tracking pass rate can silently destroy conversion. Both metrics need to be monitored together with segment-level breakdowns.
What are the most common reasons KYC checks fail at first attempt?
The three main causes are document capture failures (blurry, poorly lit, or partially cropped images), OCR errors on document types or scripts the system wasn't trained to handle natively, and compliance rule miscalibration, where thresholds set for one market or name format generate false positives when applied to a.


